Templates · 7 min read
Trading Journal Template: Excel and Google Sheets Fields
A practical trading journal template for Excel, Google Sheets, or Notion, with core columns, formulas, screenshot handling, and a weekly review routine.
Updated 2026-10-12 · TradeLogger Research
Quick answer
A trading journal template should log date, market, direction, entry, exit, planned risk, setup, context, emotion, screenshot link, result in R, process grade, and lesson. Use Excel, Google Sheets, or Notion with dropdown tags. Upgrade to software when screenshot links and filters become the bottleneck.
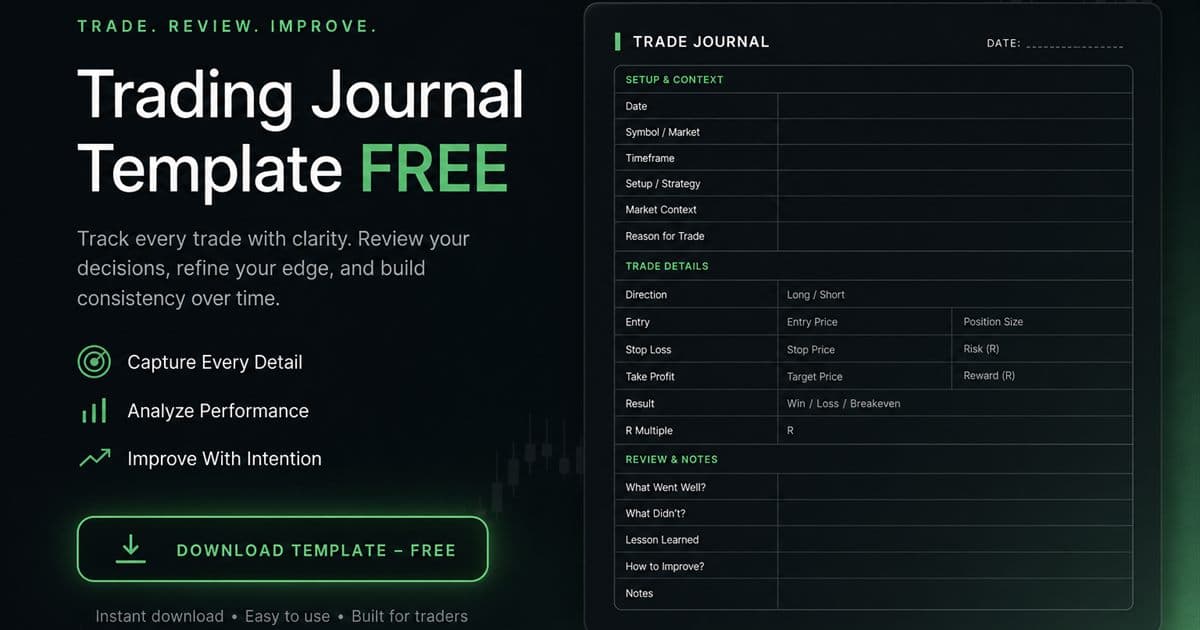
A trading journal template is the shortest structure that still records the plan, the execution, the chart evidence, and the review outcome. Excel, Google Sheets, and Notion all work if the columns stay stable. This page is the single template hub. For the broader process, use the foundational guide to trading journals. Excel-only formulas live on the Excel trading journal guide; shareable sheets live on the Google Sheets trading journal guide.
What should you write in a trading journal template?
Write the same fields on every trade so fifty rows remain comparable: date and session, symbol, direction, fills, planned risk, setup, emotion, screenshot link, R result, process grade, and one lesson. A blank page after a +3R winner and a scratch produces noise, not data. Professional desks review process, not only outcomes.
| Column | What to record |
|---|---|
| Date & time | Open-to-close lifecycle and session (London, New York, Asia). |
| Symbol / market | Instrument identifier: pair, ticker, contract, or asset class. |
| Direction | Long or short. |
| Entry & exit price | Actual fills, not intended levels. |
| Position size | Lots, shares, or contracts—one consistent unit. |
| Stop loss & take profit | Risk and reward defined before entry. |
| P&L (R-multiple) | Currency result and result versus planned 1R. |
| Setup / strategy | Named pattern or rule set from a small playbook. |
| Market context | Trend, volatility, levels, news, session. |
| Emotional state | Calm, FOMO, revenge, overconfidence—honest labels beat perfect entries. |
| Screenshot / chart | Structure at entry and, when useful, at exit. |
| Lesson / review | One sentence: what to repeat or avoid. |
Suggested header row: Date, Time, Market, Symbol, Direction, Entry, Exit, Stop, Size, Fees, Planned_R, Result_R, Setup, Session, Market_Condition, Emotion, Execution_Tag, Screenshot_URL, Process_Grade, Lesson. Freeze the header, turn on filters, format as a table, and lock formulas so sorting cannot break references.
How do you define R before writing formulas?
One R is the amount you planned to lose if the initial stop was hit. On a simple stock trade that is stop distance times shares plus expected costs. Contract value and leverage change the math on other products. Result_R is net P&L divided by planned R. If planned R is zero or missing, leave the ratio blank.
Which spreadsheet formulas answer real review questions?
Formulas should force a decision, not decorate the sheet. High win rate with oversized losses is still a poor expectancy. One outlier can fake a strong average. Always show trade count next to grouped metrics. A small sample is a question, not an edge.
- Total R: sum of valid Result_R values.
- Average R: total R divided by comparable trade count.
- Win rate: profitable closed trades divided by closed trades, excluding blanks.
- Average win and average loss, read together.
- Profit factor: gross profits divided by absolute gross losses.
- Pivot by setup: count, average R, and process-grade rate.
How do you keep tags clean with data validation?
Put setup, session, market condition, emotion, and execution tags on a separate Lists sheet and apply dropdown validation. Spelling variants split pivot tables. Add a new label only when it is a distinct review category with a written definition. Notion databases should use the same select properties rather than free text.
How should you store screenshots without bloating the workbook?
Do not embed full-resolution images in every row. Keep files in a local or cloud folder and store the link in Screenshot_URL. Name files like `2026-07-30_EURUSD_long_01` so they sort. Strip private account details before you store or share a screenshot. If folder moves and permissions already eat review time, that is an upgrade signal.
How should you review a trading journal daily, weekly, and monthly?
Log during the session. After the close, ask which setup had the best expectancy and whether you overtraded after losses. Weekly, check average R, max drawdown, and one rule to tighten. Monthly, slice by session, symbol, and holding time. The template only works if you still fill it after a losing day.
- Cross-check the sheet against broker history and add missing trades.
- Audit formula errors, blank risk fields, and inconsistent tags.
- Grade process before filtering by profit or loss.
- Compare setup and session groups with sample size visible.
- Open screenshots for outliers and repeated rule breaks.
- Log one behavior to keep and one controlled experiment.
When is a static template not enough?
Migrate when maintenance reduces completeness: screenshots scattered across folders, tags that need constant cleanup, rows delayed until the weekend, or calendar analysis that requires rebuilding pivots. Software should keep the same transparent fields with less retyping. It must not present unverified values as authoritative.
TradeLogger is the upgrade path when the bottleneck is screenshot transcription: upload the chart, confirm drafted fields, add tags, and review on a calendar instead of chasing image links. Run it beside the sheet for a few weeks and keep whichever record is more complete. Start free on a spreadsheet via the best free trading journal path if you are not ready to pay. TradeLogger has no free journaling plan; plans are $4.99/week, $34.99/year, or $69.99 lifetime with a 7-day trial on weekly and yearly.
Frequently asked questions
What columns should a trading journal template include?+
Date, instrument, direction, entry, exit, stop, size, planned risk, setup, context, emotion, screenshot, result in R, process grade, and lesson. Freeze the header and protect formula columns.
Does this template work in Excel and Google Sheets?+
Yes. The column structure is the same. Use data validation for tags, protected formula columns, filters, and screenshot links stored outside the workbook. Notion can mirror the same fields as a database.
Which trading journal formulas are actually useful?+
Total R, average R, win rate, average win, average loss, and profit factor. Group by setup and always show trade count. Do not treat a small sample as a stable edge.
When should you leave a spreadsheet template for an app?+
When screenshot storage, duplicate tags, mobile capture, or repeated filtering makes the sheet inaccurate. Move to lower friction, not a prettier dashboard.
Related guides
- Best Free Trading Journal: Start Simple, Upgrade on Evidence
Create a functional, free trading journal using a spreadsheet. You must also honestly compare all the free tiers available, and learn to recognize those specific workflow signals that justify making the upgrade.
- How to Review a Trading Journal Weekly
A weekly review checklist, designed for 30–60 minutes, that converts your trade logs into specific rules for the following week.
- Forex Trading Journal: Fields, Sessions, and Review Guide
Build a forex trading journal around pair, session, spread, risk in R, chart evidence, execution, and a repeatable weekly review.
- Trading Journal Guide: Setting Up a Review System That Endures
Learn what to record, how to choose between spreadsheets and software, and how to turn trade evidence into a practical weekly review.
Keep the template, reduce the typing
Try TradeLogger when screenshot links and manual rows become the bottleneck.
Start free to sign up