Fundamentals · 5 min read
How to Review a Trading Journal Weekly
A weekly review checklist, designed for 30–60 minutes, that converts your trade logs into specific rules for the following week.
Updated 2026-07-30 · TradeLogger Research
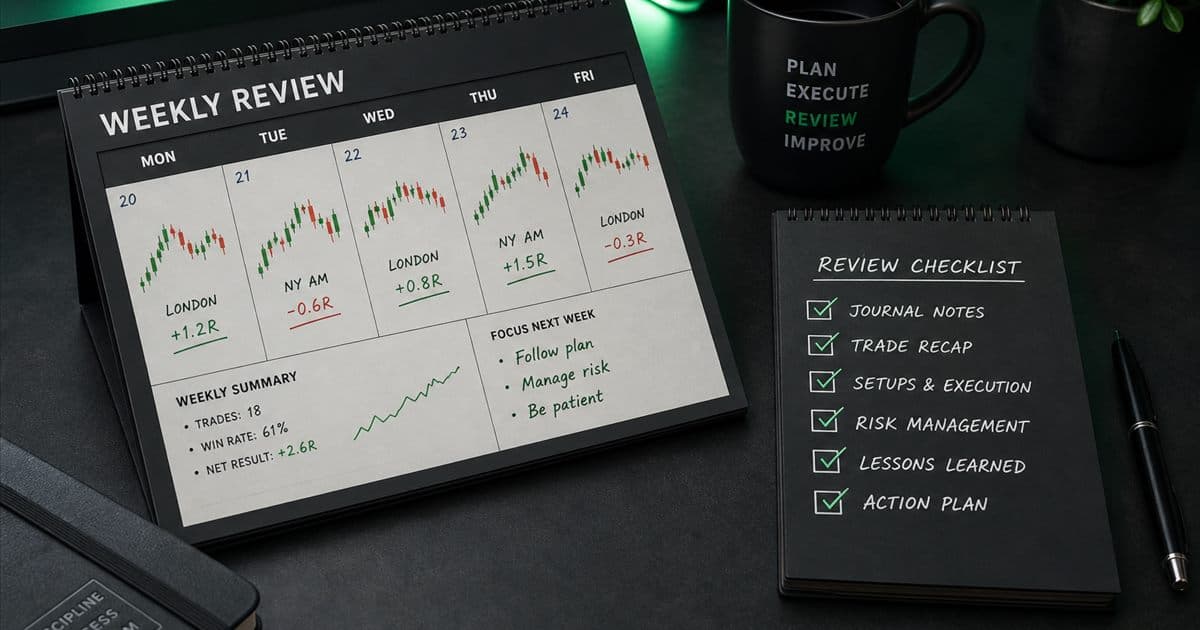
Quick answer
Dedicate 30 to 60 minutes each week to a formal review. During this time, you should first filter your trades based on the setup used, then segment them by session. Next, take time to scan your emotions surrounding those trades, select a single rule that needs improvement, and finally, distill everything into a concise, one-line summary.
Reviewing your trading journal weekly transforms disconnected trades into a genuine feedback loop. The point isn't to go through every candle or churn out some massive report. Instead, you need to verify the evidence, look at decisions that felt similar, and pick just one specific behavior to track and measure next week.
Thirty to sixty focused minutes is enough for a weekly review if the fields were filled during the week. Schedule it after the last session and before the next plan. Keep the same sequence so mood does not pick which trades you inspect. This spoke sits under trading journal basics and the foundational guide to trading journals.
1. Clean the data first
When records are incomplete, the conclusions you draw will inevitably be misleading. Before you start hunting for any edge, you must first locate every missing trade, screenshots, tags, and results. It's crucial that you confirm any image-based field suggestions against the actual execution details. Furthermore, use a single, consistent definition for 1R throughout the entire week, ensuring you properly mark all demo, replay, or live trades.
- Make sure the trade count exactly matches the details listed in your account record.
- We must confirm the entries, exits, size, and any relevant fees.
- We need to ensure we incorporate the setup and session tags that are currently missing.
- Aligning the planned against the realized R.
- Clearly identify every trade—separating those that followed the predefined rules from those that violated them.
- Before we dive into the review, ensure you've attached the relevant chart context.
2. We'll kick things off by reviewing the weekly overview.
When reviewing performance, don't just focus on net P&L. Instead, scrutinize total R, the sheer number of trades taken, the win and loss distribution, and the overall calendar shape. It's crucial not to let the final dollar figure become your only metric. Remember that a "green" week might be fueled by reckless sizing, while a "red" week could actually reflect the disciplined execution of genuinely valid setups. The key is to rigorously separate financial outcome from process quality.
Watch closely for any massive trades or unusually large trading days. Outliers can dominate a short sample, potentially causing your average performance to look significantly stronger or weaker than your typical trading decisions actually indicate.
3. Review by setup
You need to isolate and filter each setup individually. Once done, compare the trade count, total R, average R, and how well the rules were followed. After that, pull up the screenshots. You must check if the same tag was used only for structures that are truly comparable, or if loose labeling just bundled several different strategies together.
- Which specific setup delivered the highest and lowest total R?
- Which setup demonstrated the smoothest execution?
- Could the entire apparent outcome simply stem from a single, isolated outlier?
- When you look at those losses, are we talking about something that was intentionally structured, or is it just the inherent randomness of market variance? Or maybe it’s worse—are we seeing repeated violations of the core rules?
- What kind of scenarios qualify to be included in a strategic playbook?
4. We need to break down the overall performance metrics. The key here is to segment the data—we must look at how performance varies when sliced by session and by specific condition.
Day and intraday strategies often perform differently, depending on the session and what the market is doing. Take a look at when you trade, but please don't try to nail down one permanent rule based on just a single week. Instead, watch for patterns: maybe you always chase trades late in the session, or perhaps you make too many tries right after the market opens, or maybe your execution just gets soft during low volatility periods.
5. Take a moment to inspect your emotional state and rigorously check for any rule breaks.
Before you dive into the P&L of individual trades, you must first review the emotion tags and notes. Specifically, look for behavioral sequences: frustration emerging after a loss, FOMO kicking in after a missed move, or confidence building after a winner. Also, pay attention to how target pressure appears near the end of the week. Be sure to include all profitable rule breaks in your tracking. Remember this: if you reward a poor process just because the trade won, you are making the next breach far more likely.
- Pinpoint the initial controllable deviation that appears within every sequence.
- Pinpoint the underlying trigger. This could be tied to a recent loss, a missed trade, or simply facing severe time pressure.
- We need to quantify the associated cost, analyzing both R and attention.
- We need to establish a guardrail mechanism designed to activate prior to the next market deviation.
**6. Pick one experiment for next week.** We need to fine-tune this rewrite. The goal is to change roughly 0.50 of the tokens. Think of it like this: a setting of 0 leaves the wording untouched, while a setting of 1 means a full rewrite. If you run it at low intensity, stick close to the original structure and word order. Only swap out function words or a few minor content words. But if you dial up the intensity high, you need to change the wording substantially at the token level. Crucial rule: Preserve every single fact, number, name, and technical identifier. And absolutely do not add or subtract any claims.
The key is to take the most consistent, recurring issue you spot and distill it into a super-specific rule. You can't score something vague like "Be patient." But a concrete rule, such as "No market order more than one candle after the trigger," absolutely can be measured. Once you define that, hold all your other variables constant, and figure out exactly how you plan to track compliance. Remember, the whole point here is to test whether this change actually improves your execution quality—not to promise that you'll have a profitable week.
Write a short weekly summary
- The final outcome summarizes the total R and the overall trade count.
- This evaluation measures either the percentage or the raw count of trades that adhered to the defined system rules.
- The pattern we see here? It boils down to one single, repeated dynamic: either a consistent strength or a critical leak.
- To build the complete evidence picture, we had to review four key areas: the initial setup, the trading session itself, the emotional state involved, and the accompanying screenshots.
- For the week ahead, the immediate focus needs to be establishing one specific, measurable rule.
We wrapped up the week up +2.4R, accumulating that return across 11 trades. Unfortunately, three entries executed late during the New York session violated the timing rule, ultimately costing 1.8R. Looking ahead, remember that no new entry will be permitted after the established session cutoff.
Steer clear of the common pitfalls when analyzing reviews.
Don't shift your strategy just because you hit two losses. Ignore rule breaks on winning trades, and never compare unrelated setups as if they were a single sample. Never confuse a nicely polished summary with genuinely reliable evidence. If your sample size is small, focus intensely on execution and keep gathering comparable trades.
TradeLogger simplifies this whole process because it groups together screenshots, tags, R, and calendar context. If your current review relies on memory, I recommend running a full week first, and then using the checklist above before you decide what needs changing.
Frequently asked questions
How much time should you dedicate to a weekly review?+
If the necessary fields were populated during the week, thirty to sixty minutes should be plenty of time.
Seriously, imagine logging a truly green week. How would that look on the charts?+
We are still reviewing the data. Those strong "Green weeks" often conceal underlying process breaks that tend to show up later on.
What's the minimum trade count necessary to make any subsequent review truly useful?+
Take a look back at the trades you made, but hold off on declaring major strategy successes based only on a handful of examples. Before drawing conclusions, your immediate focus must be on ensuring data accuracy and proper rule execution. Only after that should you start building robust evidence across a wider range of comparable trades.
When you go through your weekly journal review, what are the key insights you should actually walk away with?+
First, provide a quick factual rundown. Identify one positive behavior you successfully maintained. Pinpoint a single, measurable change to implement next week. Lastly, note any corrections or adjustments required within your journal or risk process.
Related guides
- 7 Common Trading Journal Pitfalls That Obscure Your True Outcomes
Seven typical trading journal errors—and how they mess up your review—plus a practical workflow for creating records that are both complete and truly comparable.
- Trading Journal Guide: Setting Up a Review System That Endures
Learn what to record, how to choose between spreadsheets and software, and how to turn trade evidence into a practical weekly review.
- Prop Firm Trading Journal: Track Rules Before You Blow Up
Tracking your progress during proprietary firm challenges requires disciplined journaling. You must rigorously track daily loss, maximum drawdown, profit targets, and the number of trading days.
- Trading Journal Template: Excel and Google Sheets Fields
A practical trading journal template for Excel, Google Sheets, or Notion, with core columns, formulas, screenshot handling, and a weekly review routine.
- Seriously: How to Master Trading
The unglamorous path to better trading: define one setup, control risk, collect evidence, review mistakes, and repeat long enough to improve.
- Stock Trading Diary: Fields, Examples, and Weekly Review
You should structure your stock trading diary by analyzing catalysts, assessing risk in R, documenting chart evidence, reviewing execution quality, and conducting a repeatable weekly review.
- What Is a Trading Journal? Definition, Fields, and Examples
A complete definition of a trading journal, the fields it should contain, how it differs from broker history, and how to start.
- Why a Trading Journal Is Important: 6 Practical Benefits
The value of trading journals for discipline, psychology, and risk management—and what they simply cannot accomplish.
Make reviews shorter
Calendar heatmaps and tags keep the weekly pass focused.
Try TradeLogger