Stocks · 5 min read
Stock Trading Diary: Fields, Examples, and Weekly Review
You should structure your stock trading diary by analyzing catalysts, assessing risk in R, documenting chart evidence, reviewing execution quality, and conducting a repeatable weekly review.
Updated 2026-07-30 · TradeLogger Research
Quick answer
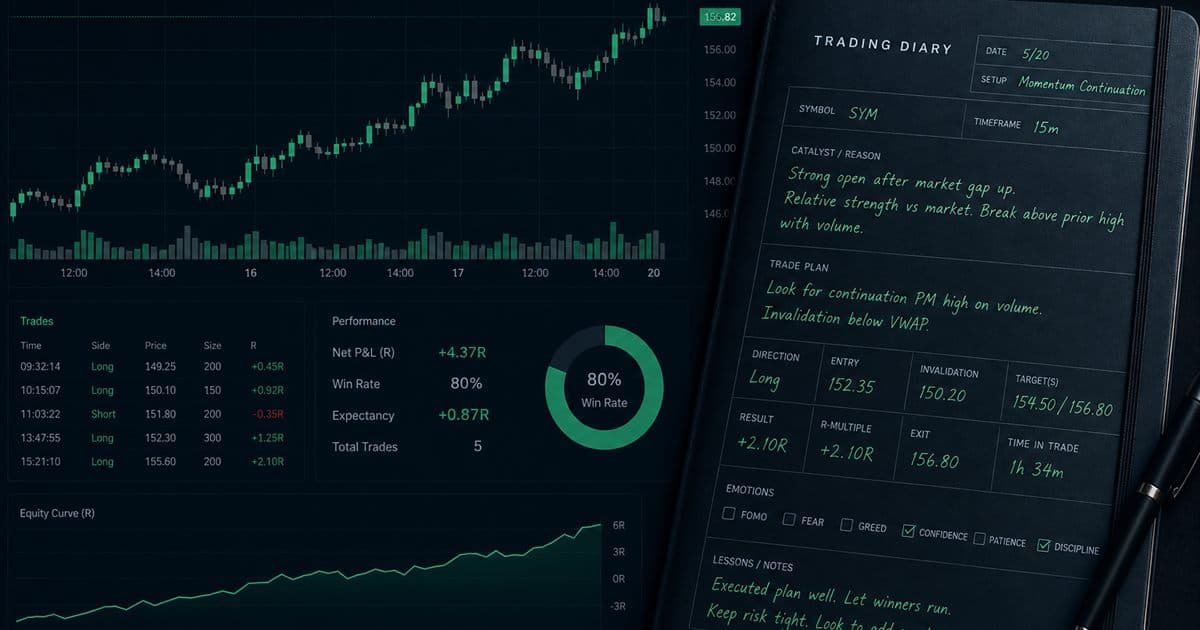
The stock trading diary functions as a comprehensive log, capturing every detail of an equity trade. It records the catalyst, the setup, the planned risk, the liquidity context, a chart screenshot, the execution specifics, the final result in R, and the crucial lesson learned—all so I can easily review similar trades later on.
A stock trading diary explains why a ticker moved, not only that it did. Capture earnings, session, liquidity, planned risk, and chart evidence in consistent fields so you can compare like with like. This spoke sits under trading journal basics and the foundational guide to trading journals.
When structuring an equity trade, keep these core data fields in mind.
- To execute a trade, you need to specify the Symbol and the desired direction, along with the precise share size. Beyond those core parameters, you must also track the entry and exit points, the associated fees, and, critically, the timestamps.
- The primary catalyst is always one of these things: earnings, guidance changes, major news events, specific analyst actions, broad sector moves, or pure technical signals.
- The trade parameters—specifically the setup name, the market regime, and whether the execution was intraday or swing—must be identified.
- The key variables we need to track are the initial stop, the planned dollar risk, the resulting R multiple, and the maximum size.
- Depending on the market environment, metrics related to liquidity—specifically spread, volume, and slippage—become critical when they are material.
- You'll get the pre-entry chart, the exit chart, the execution tag, plus one sharp lesson.
Whenever possible, stick with the controlled choices. If an earnings setup gets tagged inconsistently—say, sometimes “ER,” sometimes “earnings,” and sometimes “gap news”—your sample data will fragment. While free text is still important for unusual context, the fields you plan to compare absolutely need to remain stable.
Record catalysts without rewriting the news
The journal shouldn't demand a complete news summary. Instead, simply log the catalyst category, its timing, and what specifically made it relevant to your plan. For instance: “earnings after close, positive guidance, gap above prior range.” Crucially, avoid claiming the catalyst caused every single price movement; your diary is documenting the information you utilized, not attempting to prove market causation.
Assessing risk requires looking at both the dollar amount and the R value.
While Dollar P&L is the figure that truly impacts your account, the R metric gives you a much clearer way to compare trades, especially when prices and share sizes vary widely. For example, if you set out to risk $100 but ultimately netted $180 after costs, that translates to approximately +1.8R. Conversely, if you widened your stop and lost $150, you need to record both the intended 1R loss and the actual 1.5R loss. That gap, that specific difference, is what identifies execution drift—the critical error that simple raw P&L figures hide from you.
Grab the chart that dictated the final decision.
When setting up intraday trades, make sure to save the relevant timeframe displaying the entry area, the stop logic, and nearby price levels. If premarket action or a daily level fundamentally shaped the trade, be sure to include that context as well. Swing traders, for instance, often require both the daily chart and the specific execution timeframe. A screenshot taken only after the move can be helpful, but it always succumbs more easily to hindsight than an image captured before the trade entry.
A brief sample of a trading journal.
- XYZ is a strong long hold for the regular session, thanks to the stellar earnings report and subsequent raised guidance.
- When the initial range pulls back, hold off. Wait for that range to be reclaimed before you consider an entry.
- We are setting the planned risk exposure at $120. This means that one full unit of risk (1R) is strictly defined starting from the point of entry all the way down to that initial stop.
- Volume is high relative to the norm, and the spread remains acceptable. For now, we are holding no position until the next earnings cycle.
- I've attached the entry and exit screenshots. The execution tracked the plan perfectly.
- The net result landed at +1.4R. The key strategic lesson we must internalize from this is clear: absolutely do not chase that initial first extension.
Intraday traders and swing traders require vastly different contexts to operate effectively.
For the intraday trader, the focus is extremely tight: they emphasize opening market conditions, halt risk, the specific time of day, the spread, and ensuring rapid execution. Swing traders, by contrast, require a much broader outlook. They prioritize thesis duration, overnight gap risk, upcoming earnings dates, overall sector exposure, and clear reasons to remain in the position.
When tracking trades, are you leaning toward the traditional paper diary, a detailed spreadsheet, or perhaps specialized trading software?
Manual paper trading can slow down your thinking, but trying to filter dozens of trades based on a specific catalyst or setup is inherently difficult. A spreadsheet handles formulas and pivots nicely, but you still have to manage the workload associated with image links and tag cleanup. Journal software steps in and helps when the process of data capture and retrieval becomes a bottleneck. Ultimately, no format removes the requirement for verification: you must still check prices, split adjustments, partial exits, and all extracted fields.
A weekly stock review
- Ensure every trade execution is reconciled against the diary, making sure to correct any missing fields along the way.
- Cluster trades based on the underlying catalyst and the technical setup, rather than grouping them simply by ticker popularity.
- We need to compare the planned risk against the actual risk, and finally, evaluate the resulting outcome within R.
- Let's closely inspect low-grade winners and high-grade losses to determine if there is any outcome bias present.
- We need to examine the screenshots corresponding to the trades that showed the largest slippage or the most significant rule-break.
- Let's narrow it down. Over the next week, select just one execution behavior for testing.
TradeLogger facilitates this entire workflow. It pulls proposed fields directly from an uploaded chart, leaving the row fully editable, while also letting you attach setup or emotion tags for easy calendar review. Just so we're clear, the tool won't select stocks for you or validate the catalysts. Its real value lies in minimizing the distance between a simple trade screenshot and a permanent, searchable record.
Frequently asked questions
Do a stock trading diary and a trading journal actually mean the same thing?+
These terms are interchangeable. When analyzing stocks, the real difference comes from adding equity-specific context—factors like catalyst, relative volume, gap, liquidity, and earnings risk.
How should I log the details for an earnings trade?+
You need to log several details: first, was the earnings announcement pre-market or post-market? Then, document the specifics of the gap, liquidity, spread, and initial setup. Crucially, note the planned risk, the existing chart context, and whether the trade adhered to your specific earnings-related rules.
Should serious long-term investors be keeping a stock diary?+
Sure, the available fields are completely different. Instead of tracking granular intraday execution details, investors can log crucial elements like their thesis, valuation assumptions, time horizon, position sizing, catalysts, disconfirming evidence, and scheduled review dates.
How exactly do you calculate the R value for a stock trade?+
Your "One R" is determined by the planned loss incurred between entry and the initial stop, multiplied by your shares, and subsequently adjusted for any expected costs. To complete the calculation, simply divide your final net P&L by that calculated planned amount.
Related guides
- What Is a Trading Journal? Definition, Fields, and Examples
A complete definition of a trading journal, the fields it should contain, how it differs from broker history, and how to start.
- Trading Journal Guide: Setting Up a Review System That Endures
Learn what to record, how to choose between spreadsheets and software, and how to turn trade evidence into a practical weekly review.
- How to Review a Trading Journal Weekly
A weekly review checklist, designed for 30–60 minutes, that converts your trade logs into specific rules for the following week.
- 7 Common Trading Journal Pitfalls That Obscure Your True Outcomes
Seven typical trading journal errors—and how they mess up your review—plus a practical workflow for creating records that are both complete and truly comparable.
- Seriously: How to Master Trading
The unglamorous path to better trading: define one setup, control risk, collect evidence, review mistakes, and repeat long enough to improve.
- Why a Trading Journal Is Important: 6 Practical Benefits
The value of trading journals for discipline, psychology, and risk management—and what they simply cannot accomplish.
Always ensure the trade you take has its roots planted firmly in the chart context.
Try TradeLogger if a screenshot-first stock diary would be easier to maintain.
Start free