Fundamentals · 5 min read
So, what exactly is a trading journal? We're going to cover the fundamentals—what it is, what fields you need to track, and some practical examples you can use right away.
Want to build a powerful trading journal? We'll give you a complete definition of what it is, outline the essential fields you need to track, explain how it fundamentally differs from your broker history, and walk you through how to start today.
Updated 2026-07-30 · TradeLogger Research
Quick answer
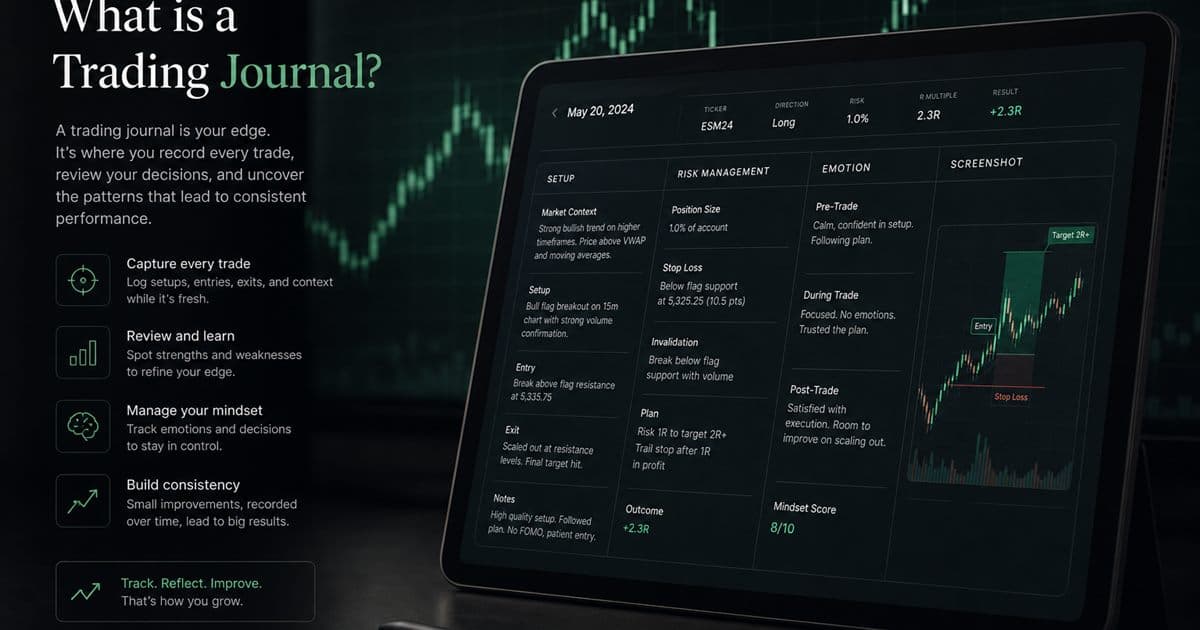
A trading journal isn't just a log; it's a detailed, structured record of every trade you take. It acts as a comprehensive hub, synthesizing the raw transaction facts with the original investment plan. Crucially, it pulls together everything else: the supporting chart evidence, the prevailing market context, how you managed risk, your emotional state during the trade, specific execution notes, and ultimately, the data required for later review.
A trading journal—sometimes called a trade diary or a trade log—is essentially a structured record of every trade you take and the reasoning behind it. It blends objective data, things like market conditions, position size, price, time stamps, fees, and the final result, with the qualitative elements: how you planned the setup, the risk you intended to take, the chart context, your emotional state, and the decisions you made during execution. Don't think of it merely as a documentation exercise. Its real power comes from creating evidence that you can systematically compare and analyze when you review your performance.
When we talk about tracking performance in the markets, you have two distinct records: the trading journal and the broker history. It's crucial to understand the fundamental difference between these two data sets.
Broker history gives you the raw data—it tells you what was filled. That record can show you the orders, the quantities, the prices, the commissions, and the resulting realized profit or loss. However, a journal answers the questions that the statement just can't cover: What specific setup qualified? Where exactly was the trade invalid? Was the risk properly planned? What was the chart like right before you entered? Did you adhere to the exit rule? Because of that distinction, simply importing transactions won't provide you with a complete journal.
What truly makes a trading journal valuable? It's rooted in understanding its four essential layers.
1. Trade facts
The foundational dataset—the base row—must contain these core facts: date, instrument, direction, entry, exit, size, stop, target, fees, and timestamps. You absolutely must verify these figures, because every subsequent calculation relies entirely upon their accuracy. When tracking trades, consistently record partial exits or scaled entries; never force a complex position into a single, misleading price.
2. Plan and context
The strategy outlines precisely why the trade was justifiable. Always employ a specific setup name sourced from a limited playbook, alongside the invalidation condition, relevant market regime, session details, catalyst, and the intended management rule. These elements must remain concise and consistently repeatable. Filtering through a paragraph whose meaning shifts daily presents a serious analytical hurdle.
3. The psychological component and how market behavior unfolds
Emotions only become useful when they connect directly to how you execute trades. So, you need to quickly log the specific emotional state you were in—say, calm, hesitant, impatient, or revenge-driven—and then document the corresponding action: did you enter early, cut the size, adjust the stop, or exit exactly as planned? Doing this prevents your psychological review from turning into meaningless guesswork about every single trade that goes wrong.
4. Evidence and review
A chart screenshot preserves crucial detail that structured fields simply cannot capture: things like the exact location, volatility, nearby levels, and what was visible right at the decision point. Once the trade is over, a subsequent review allows us to apply a process grade and identify one key lesson. The screenshot itself acts as concrete evidence, while the row and associated tags are what make those groups searchable later on.
A simple trading journal example
- We are looking at EURUSD, timing the entry during the London session. The position here is long.
- The core setup requires a pullback continuation. However, this pattern is void if the price breaches below the prior swing level.
- We had originally planned for a 1R risk, but following the reduction in position size, the actual realized risk landed at 0.8R.
- The evidence is clear: check out the pre-entry chart and the exit screenshot.
- The trading behavior was spot-on: the entry was calm, and the eventual exit precisely adhered to the original plan.
- The takeaway here is a positive outcome: we clocked in at +1.6R. Moving forward, the key lesson is to hold off until we see that same confirmation signal again.
Though the example is brief, remember that every single field serves an analytic purpose. Once you've logged 20 similar records, you gain the ability to compare this setup across various metrics—whether by session, execution grade, or market condition. Frankly, a lengthy narrative might feel comprehensive, but it often complicates the actual comparative analysis you're trying to run.
Starting your trading journal: A complete guide to getting set up.
- What storage method will you use? Choose from a notebook, spreadsheet, or journal app.
- Pinpoint five to ten mandatory data fields, and also create a brief checklist for the setup.
- Make sure you map out the planned stop and chart those levels right before—or near—the entry point, whenever possible.
- Following the market close, it is critical that you confirm the prices, verify the result recorded in R, and carefully review the execution behavior.
- You have to reconcile every single trade at the close of the day, making absolutely certain that no ordinary trades get missed.
- Schedule a weekly review session, and make sure you only adjust one specific measured behavior at any given time.
How exactly should you go about reviewing your trading journal?
Always prioritize data completeness over immediate performance metrics. You need to correct any missing fields and eliminate duplicate tags first. Once the data is clean, inspect rule adherence and review your results, making sure to break those findings down by setup, session, or market condition. While the average R is a key metric, you must also examine the full range of outcomes and the sample size. Lastly, don't just rely on the numbers; read the screenshots behind any pattern. Statistics might flag a question, but the chart context is typically what provides the real explanation.
Common formats and their trade-offs
Paper is excellent for deep thought and reflection, but trying to search through it later is a nightmare. Spreadsheets offer flexibility and are cheap, true, but you quickly run into maintenance headaches—dealing with screenshots, keeping formulas stable, and ensuring tag consistency is a huge chore. While software streamlines the capture process and gives you powerful filtering tools, remember that even automated systems still require human verification. Ultimately, the most effective format is always the one that is the simplest to keep fully complete and that you can commit to reviewing on a regular basis.
TradeLogger works with a practical definition, not as a replacement for your own judgment. You simply upload the chart, then inspect and edit the extracted fields, add tags, and then circle back to the trade via calendar review. If this saves enough typing time to keep the habit alive, it could be a helpful next step; however, if your existing spreadsheet is already staying completely up-to-date, just stick with it.
Frequently asked questions
A trade log versus a trading journal—how do you actually tell the difference?+
The trade log tracks all transactions, capturing details like symbol, size, entry, exit, and P&L. Separately, the journal goes deeper, adding intent, context, risk assessment, screenshots, psychological notes, execution quality, and the resulting lessons.
So, what exactly needs to be tracked and included in your trading journal?+
At minimum include date, market, direction, entry, exit, planned risk, setup, result in R, chart screenshot, execution grade, and a short lesson.
Can a spreadsheet actually function as a proper trading journal?+
Absolutely. A spreadsheet works, provided you can keep it complete, store or link screenshots, apply consistent tags, and review the records without excessive maintenance.
Do I log my notes in my trading journal before executing a trade, or is it better to document it immediately afterward?+
Always define the plan and quantify the risk before, or right at, the point of entry if possible. Only once the trade closes should you then document the actual execution, the final result, your emotional response, and the key lesson learned.
Related guides
- So, why should you even bother keeping a trading journal? Frankly, if you're serious about the markets, you need one. It’s not some optional extra; it's absolutely critical. We're going to break down six tangible ways that maintaining a detailed trading journal will fundamentally improve your approach and sharpen your edge.
The value of trading journals for discipline, psychology, and risk management—and what they simply cannot accomplish.
- Building your essential trading journal template: A deep dive into the necessary fields for both Excel and Google Sheets.
Need a solid trading journal? This practical template is designed for Excel or Google Sheets users. It includes all the essential columns, powerful formulas, a way to handle screenshots, and guides you through a necessary weekly review routine.
- The Ultimate Free Trading Journal: Keep things simple initially, then refine your approach based on hard evidence.
Create a functional, free trading journal using a spreadsheet. You must also honestly compare all the free tiers available, and learn to recognize those specific workflow signals that justify making the upgrade.
- Trading Journal Guide: Setting Up a Review System That Endures
We’ll walk you through exactly what you should be logging, how to decide whether spreadsheets or dedicated software is the better fit for your needs, and the process of transforming your raw trade evidence into a truly practical weekly review.
Focus initially on a single, reviewable trade.
See how TradeLogger turns chart evidence into an editable, tagged journal row.
Start free