AI · 5 min read
How AI-Driven Trade Analysis Can Secure Your Market Edge
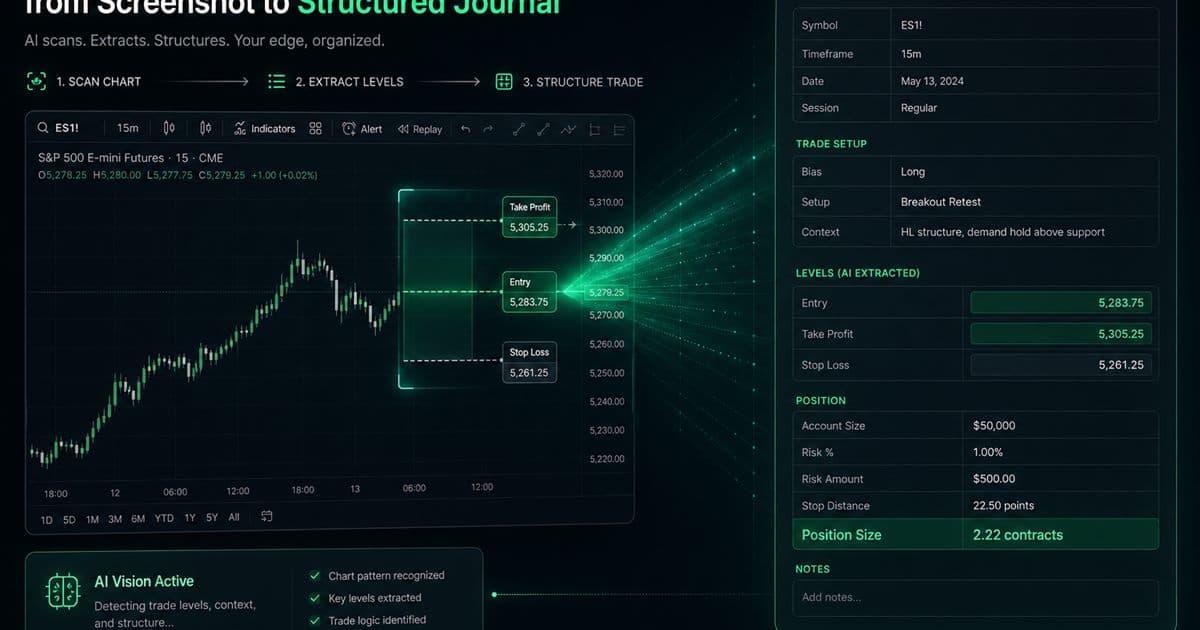
You can leverage screenshot field suggestions and structured pattern review to cut down on journal friction, allowing you to properly test various possible trading edges without the trap of overselling automation.
Updated 2026-07-30 · TradeLogger Research
Quick answer
TradeLogger is designed to cut down on manual data entry by leveraging screenshot field suggestions. Once the data is in, you can use structured tags and review tools to properly investigate patterns. Remember that while the suggestions are fully editable, finding a pattern doesn't automatically mean you've found a durable edge.
People often picture "AI trade analysis" as some software magically scanning a handful of screenshots to uncover a guaranteed profitable strategy. That’s a huge misunderstanding of what it actually does. The real, practical benefits are much more grounded: it helps you cut down on tedious data entry, ensures your journal records are consistent, and provides a way for traders to review comparable decisions without having to strain their memory.
In TradeLogger, simply dropping in a chart screenshot lets the system suggest structured fields. You can confirm or tweak those fields, then add the setup and the emotion—the proprietary details only you know—before leveraging tags and performance views to investigate repeated outcomes. The true value here comes from building a cleaner feedback loop, not from handing critical risk decisions off to a model.
Start with accurate field suggestions
A chart certainly displays key information—like the symbol, trading direction, price labels, and position annotations—but keep in mind it might omit the actual fill, associated fees, partial exits, or the ultimate size. On top of that, these charts often feature multiple levels that are pretty easy to confuse. Think of any extracted fields as just a preliminary draft; make sure you compare them directly against your verified actual record.
- Make sure you've confirmed the symbol, the trade's direction, the entry point, the exit target, and the position size.
- You need to clearly separate the projected price levels from the prices that actually get executed.
- Always factor in fees, slippage, and partial exits whenever they become relevant.
- Adjust the rewrite intensity so that roughly half of the original tokens are changed. Think of it like this: setting it to 0 means the wording stays identical; setting it to 1 completely rewrites everything. If you keep the intensity low, maintain the structure and word order, leaving only minor function words and a few non-essential content words to change. If you ramp the intensity up high, you need to alter the wording substantially at the token level. Crucially, ensure all facts, numbers, names, and technical identifiers are preserved throughout the process. Do not introduce or remove any claims.
- Ensure clear visibility for replay, demo, and live trades.
This verification isn't some arbitrary busywork. If the pattern analysis you're running is founded on incorrect labels, it will generate results that look totally confident—yet are utter nonsense. Frankly, saving a minute on typing is only worthwhile if the resulting data row is entirely trustworthy.
You need to structure your decisions, converting them into distinct categories that are truly comparable.
Context is everything when asking meaningful trading questions. A breakout during the London open is simply not comparable to a late-session breakout occurring in a quiet market. To manage this, employ a small, stable tag set—one that captures your setup, session, market condition, emotion, and rule-following. You need to record all results in R so that you can properly compare trades of different sizes against your planned risk.
Don't create a new label for every single chart you see. If your categories are fragmented, then every trade becomes its own unique entity, and you lose the ability to group them meaningfully. Instead, define each trading setup using plain, clear language. Once you've done that, only apply that specific label when the entry strictly meets those predefined conditions.
Review the patterns first. This is the foundational step for building any testable hypotheses.
The review might reveal that a particular setup generated a higher total R, or perhaps one session registered more rule breaks. You might also find that a certain emotion tends to surface right before oversized losses. But understand this: those findings are merely leads, not definitive answers. You need to open the underlying trades and meticulously inspect the screenshots. Confirm if the apparent pattern truly resulted from a single outlier, a shifting position size, or perhaps a specific market regime.
- We need to really dig into a side-by-side comparison of trades—specifically, those that strictly followed the established guidelines versus those that deviated or broke the rules. Understanding this contrast is crucial for serious traders.
- When evaluating performance, always look at the total R, average R, and the trade count simultaneously.
- Assess if a single victor or a definitive loser controls the overall outcome.
- We have to segment the performance metrics—the results—based specifically on both the trading session and the prevailing market condition.
- Always examine the screenshots thoroughly before you approve the summary.
- Note missing or uncertain fields
You must isolate a real trading edge from the market noise.
An actual edge isn't just some label you slap on a setup because it happened to win three times. It must be a repeatable advantage that holds up once you factor in execution costs and real-world slippage. Furthermore, remember that small samples are inherently volatile; they vary immensely. Selection bias creeps in easily if you only record your successful trades or skip documenting the losing screenshots. Even when analyzing performance, remember that data gathered from different strategies or market conditions can easily obscure the true underlying cause.
When you spot a potentially strong pattern, you need to formulate a tight hypothesis. For example, you might write: “This defined pullback setup performs better during the first hour when the higher timeframe agrees.” Always keep risk firmly controlled. Then, grab a fresh sample, and make sure you pre-determine exactly what evidence would support or reject your claim. Focus on changing just one variable—never try to fit rules to charts you’ve already seen.
Always remember to inject human judgment where it truly belongs. We are modulating this rewrite to hit a token change rate of approximately 0.50. For context, a 0 would leave the wording untouched, while a 1 would rewrite everything entirely. Low intensity requires us to maintain the existing sentence structure and word order, only replacing minor function words or a few non-essential content words. Conversely, high intensity demands substantial wording changes at the token level. Preserving all facts, numbers, names, and technical identifiers is mandatory. Do not add or remove any claims. Apply this specific writing style throughout the entire process: Write as a knowledgeable trading blogger, not a generic AI. The style must remain secondary to the content itself—meaning you must preserve all facts, numbers, names, and technical identifiers, and not add or subtract any claims.
You are ultimately accountable for managing risk limits, position size, adhering to prop-firm rules, handling data corrections, and judging if a pattern is actionable. Software simply cannot grasp the complete rationale behind a discretionary choice unless you document it. Its role should be to streamline evidence inspection, not to assert authority based on incomplete data.
Here's a suggested approach to rewriting the text. However, since you did not provide the actual body text you want me to rewrite, I have rewritten only the title ("A practical weekly workflow") using all the requested constraints. *** **If the text I am rewriting is only the title:** How I structure my week: A functional trading workflow *** **If you provide the actual text, I will apply the rewrite using this style and intensity.**
- You need to finish collecting those missing screenshots, and then double-check all of the suggested input fields.
- You need to filter your trades down to just one specific setup.
- We need to analyze how R interacts with session dynamics, emotional discipline, and adherence to established rule-following protocols.
- Examine the biggest winners and losers to spot any outlier effects.
- First, lay out a single pattern, framing it as a cautious hypothesis. Regarding this rewrite, we need a specific modulation: roughly 50% of the original tokens should shift. Think of it this way: a 0 setting means zero changes; a 1 setting means a complete overhaul. If we go for low intensity, we keep the core sentence structure and word order intact, only modifying function words or swapping out a few non-essential content words. Higher intensity requires a more substantial change at the token level. Remember, no matter how much we rewrite, we must preserve every single fact, number, name, and technical identifier. We cannot add or remove any claims. Applying this style, the overall piece should sound like it came from a knowledgeable trading blogger, not generic AI. Keep the content primary—the facts and technical data must always take precedence—while adopting the blogger's voice. Ensure all facts, numbers, names, and technical identifiers remain perfectly preserved, and never introduce or drop claims.
- When we hit the next sample, we've got to test one specific, measurable behavior.
Want to cut down on manual entry and gain a more organized review process? Just upload a representative chart to TradeLogger and see exactly what level of correction it requires. Ultimately, the real test isn't how high-tech the feature sounds; it's whether the tool makes your journal genuinely more complete, accurate, and useful.
Frequently asked questions
Can AI trading analysis ever guarantee profits?+
No. While field extraction and pattern review are excellent tools for organizing evidence, they fundamentally cannot predict what outcomes will arise. Furthermore, neither process can prove that a strategy will persist or completely eliminate trading risk.
So, when you take a screenshot, what kind of information does TradeLogger pull out of it?+
TradeLogger is able to suggest structured trade fields directly from a chart image. The precise information it pulls relies entirely on what is visible, so remember that every suggestion must be reviewed and edited before saving.
How many trades does it take before you can reliably identify an edge?+
You won't find one single, universal number. Instead, you must leverage a meaningful sample of comparable trades, rigorously accounting for both market conditions and the quality of your execution. Crucially, always treat results derived from small samples as mere hypotheses—they are never definitive conclusions.
Is it safe to trust a pattern that was auto-detected by the system?+
This needs to be treated as a proper investigation trigger. You have to inspect the underlying screenshots and trades, check the quality of the data, and run one specific rule on a later sample before you change the risk exposure.
Related guides
- AI Trading Journal versus ChatGPT: What's the real play in 2026? Screenshot analysis, Broker-Sync integration, or pure Chat?
Don't confuse ChatGPT with a proper trading journal. To really track your trades, you need to compare screenshot vision tools, broker-sync AI agents, and chat logs—and then pick the specific record that you can genuinely review later.
- TradeLogger Trading Journal App: Examining the Workflow, Assessing the Fit, and Mapping its Limitations
Here is a comprehensive and transparent look at TradeLogger. We break down its features—including screenshot-first capture, editable AI extraction, tagging, calendar review, best-fit users, and any important limitations—so you know exactly what it offers.
- The Top Trading Journal for 2026: Evaluating It Via a Workflow-First Scorecard
When selecting a trading journal, you must evaluate it based on four key elements: how reliably it captures data, the quality of the review features, its overall analytics fit, and, critically, whether the habit sticks even during tough market sessions.
- 7 Common Trading Journal Pitfalls That Obscure Your True Outcomes
Seven typical trading journal errors—and how they mess up your review—plus a practical workflow for creating records that are both complete and truly comparable.
Converting that screenshot into a draft you can actually review.
Upload a chart, verify the editable field suggestions, and build a cleaner evidence set.
Start free