Prop firms · 4 min read
Tracking how you perform in FTMO Challenges is absolutely critical. Simply taking the tests isn't enough; you have to measure your progress. When you're competing in these rigorous FTMO Challenges, simply trading isn't the goal—the goal is measurable improvement. Understanding your performance metrics allows you to pinpoint exactly where your strategy is succeeding or, more importantly, where it's falling apart. You need to monitor key data points carefully so you can fine-tune your approach and maximize your chances of passing.
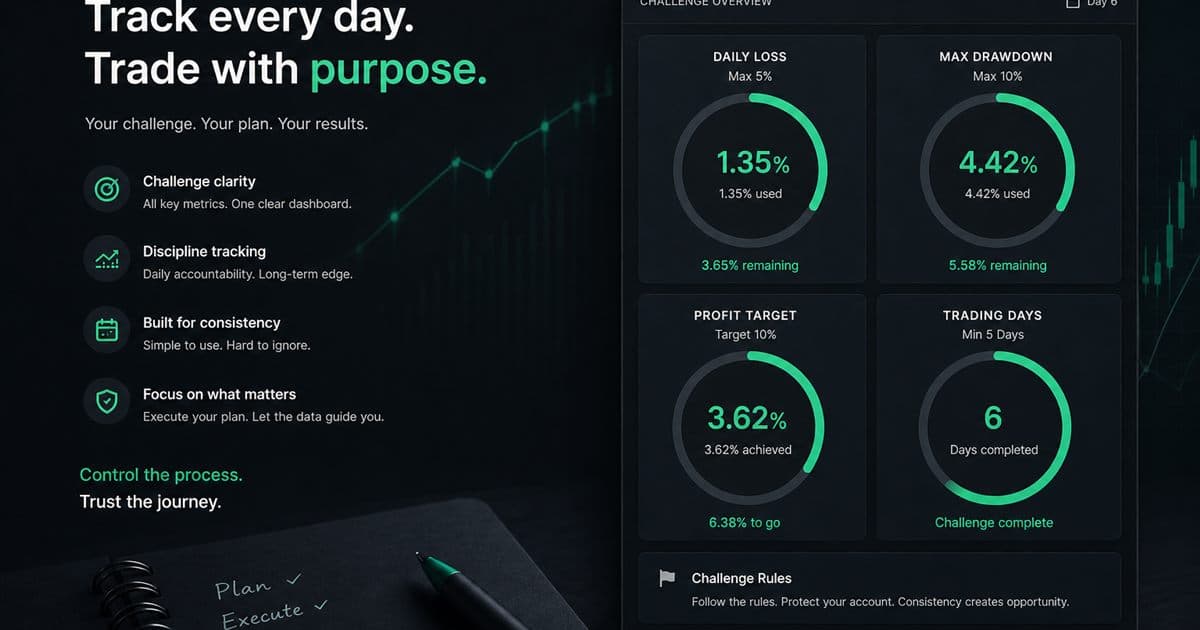
To ensure you stay compliant with FTMO rules, make sure you are constantly tracking your daily loss, drawdown, profit target, and total trading days.
Updated 2026-07-30 · TradeLogger Research
Quick answer
Keep a daily log of your FTMO-style performance. You need to monitor the loss room, the drawdown vs max, your progress toward target, and the total number of trading days. Always remember to verify the live rules directly on FTMO’s official site.
Just tracking whether your FTMO account is green isn't the same as monitoring the challenge itself. The evaluation mandates a combination of performance objectives and strict loss constraints. Importantly, a trader can certainly finish profitable overall yet still jeopardize the account. This risk can arise from a single concentrated day, excessive drawdown, or inconsistent sizing.
For account status, always consider FTMO's own dashboard and the current official terms to be the absolute source of truth. The trading journal, meanwhile, has a different mission entirely: it is where you preserve screenshots, normalize outcomes using R, tag your specific setups, and track which decisions consume your rule headroom.
Let's put together a rule-headroom scoreboard.
Before you begin a session, log the exact distance between where your current account state is and every single binding limit. You need to think in terms of headroom, not just the current P&L. The critical question isn't, “How much money can I generate today?” Instead, you must ask: “How much planned risk can the account safely carry under these existing rules?”
- Tracking the daily loss that has been utilized, and the remaining balance factored into the current calculation.
- How your current equity or balance stands relative to the maximum-loss threshold.
- Tracking our climb: Where do we stand regarding the profit objective?
- Relevant trading days: those that are required, or the ones that have been completed.
- Reviewing risk exposure across every position and all correlated ideas
- Keep in mind that your personal stop-trading limit could actually be tighter than the firm's limit.
Don't just copy percentages from some old article or another person's account. Rules, account formats, and the calculation details are all prone to change. Make sure to verify if open P&L, commissions, resets, or time boundaries influence the official score for your particular challenge.
Track every trade in R
R is the metric that gauges your trade outcome against the risk you originally planned. To put it simply, if your stop-loss was set at 1R, a loss of half that amount comes out to -0.5R, while a profit that is double your planned risk is +2R. Because of this standardization, it becomes much easier to compare different trades, regardless of whether you're using different instruments, stop distances, or position sizes.
Log your Planned R before you enter, and then capture the Realized R afterward. When there’s a disconnect between those two numbers, you might see slippage, stop movement, partial exits, or sizing errors popping up. Plus, this tracking highlights your consistency: if you take repeated small planned risks and then try to recover with one oversized attempt, that's a process flaw—even if the trade itself ends up winning.
Preserve the setup with screenshots and tags
Capture a chart screenshot that clearly shows the context right around your entry. When logging in TradeLogger, don't just blindly accept the suggested fields. Instead, carefully review those fields, and make sure to tag the setup, session, market condition, emotion, and rule-following. This screenshot is critical because it helps you distinguish between a genuine setup loss and a trade that simply failed to meet your original plan.
- Setup name and quality grade
- The trading session and exact entry timing.
- Let's talk execution: how to properly set the planned stop, define your target, and manage risk when operating within R.
- The psychological state—be it emotion or pressure—just before you execute the order.
- Did the actual size align with the figures outlined in the written model?
- Did the trade respect the personal and firm constraints?
Stop obsessing over consistency; instead, focus on measuring it. You should assess your reliability and performance metrics without the pressure of constantly trying to chase that elusive, perfect consistency.
Consistency is much broader than simply hitting an official metric. You must review whether the majority of your result stems from just one particular day, a single setup, or maybe one unusually large trade. Furthermore, compare your average planned risk, the number of trades per session, and your rule-followed performance. Don't forget: high concentration can be a signal that the whole process is fragile, even if the challenge dashboard appears positive.
Don't fabricate additional trades just to make a chart look aesthetically smooth. The true focus here is repeatable execution, not superficial data points. Sometimes, a day with zero trades, if it adhered strictly to the plan, is more valuable than a highly active day driven by pressure from targets.
You need to do a daily closeout, followed by a weekly performance review.
- You need to double-check the official challenge figures against what's showing up in the FTMO dashboard.
- Gather the missing screenshots and correct the journal fields.
- Tracking the Total realized R, we must also monitor the remaining personal risk allowance.
- You have to log every single rule violation, make sure to capture those that were profitable too. When we modify this text, we need to modulate the changes so that roughly 50% of the tokens are altered. To be clear on the spectrum: zero change means keeping the wording exactly the same, while a full one means a total overhaul. If you keep the intensity low, you maintain the core sentence structure and word order, only tweaking function words and a few minor content words; but if you go high, you change the wording substantially at the token level. The critical rule remains: preserve all facts, numbers, names, and technical identifiers. Do not add or subtract any claims.
- By the close of the week, make sure you group those results based on the setup, session, and emotion.
- Pinpoint a single, quantifiable behavior you plan to shift over the coming week.
When your available headroom tightens up, the choice to reduce exposure or simply stop becomes a process decision, not a predictive one. TradeLogger can assist you in organizing the evidence supporting that decision, but remember that it neither calculates nor certifies FTMO compliance. If you want a structured screenshot and tag workflow to supplement the official tools, I recommend starting with a few challenge trades to see if the review process clears up for you.
Frequently asked questions
Let's confirm: do the rule numbers provided in this guide actually correspond to the official FTMO limits?+
Because account types and associated terms are always subject to change, we haven't provided specific percentages here. Make sure you verify every objective, limit, and the exact calculation method using your current FTMO dashboard and the official FTMO materials.
Is TradeLogger designed to take the place of FTMO's existing client tools?+
FTMO handles official account metrics and objective data using its own dedicated client tools. Separately, TradeLogger functions as your personal journal. This is the place you log everything: screenshots, R results, specific setup tags, emotional notes, and comprehensive review.
When running an FTMO challenge, what specific metrics should I be tracking?+
You need to monitor several key metrics: specifically, the daily-loss headroom and the total drawdown headroom. Beyond that, log your progress toward the target, track your consistency, note the result in R, detail the setup, log the session, and confirm whether every single trade adhered to your established rules.
What's the best cadence for logging updates in the challenge journal?+
Make sure you log every single trade right after it closes. Then, before you jump into the next session, reconcile those daily figures against the FTMO dashboard.
Related guides
- Prop Firm Trading Journal: Always Track Your Rules Before You Get Wiped Out
Tracking your progress during proprietary firm challenges requires disciplined journaling. You must rigorously track daily loss, maximum drawdown, profit targets, and the number of trading days.
- A Trader's Journal for Day Trading
You need session tags, screenshots, and same-day logging—tools that reliably survive when you hit high trade volume.
- Forex Trading Journal: Fields, Sessions, and Review Guide
You need to construct a robust forex trading journal. This record should track fundamental elements like the trading pair, session activity, spread performance, and managed risk. Furthermore, integrate analysis using R, document chart evidence, review execution quality, and ensure you incorporate a repeatable weekly review cycle.
Journal the challenge
Keep screenshot evidence, R, and setup tags beside the official challenge figures.
Start free