When Pine Script Leaves the Chart
Porting a multi-filter strategy without losing the plot
Pine parity · signal columns · no drawing fluff
July 1, 2026 · 8 min read
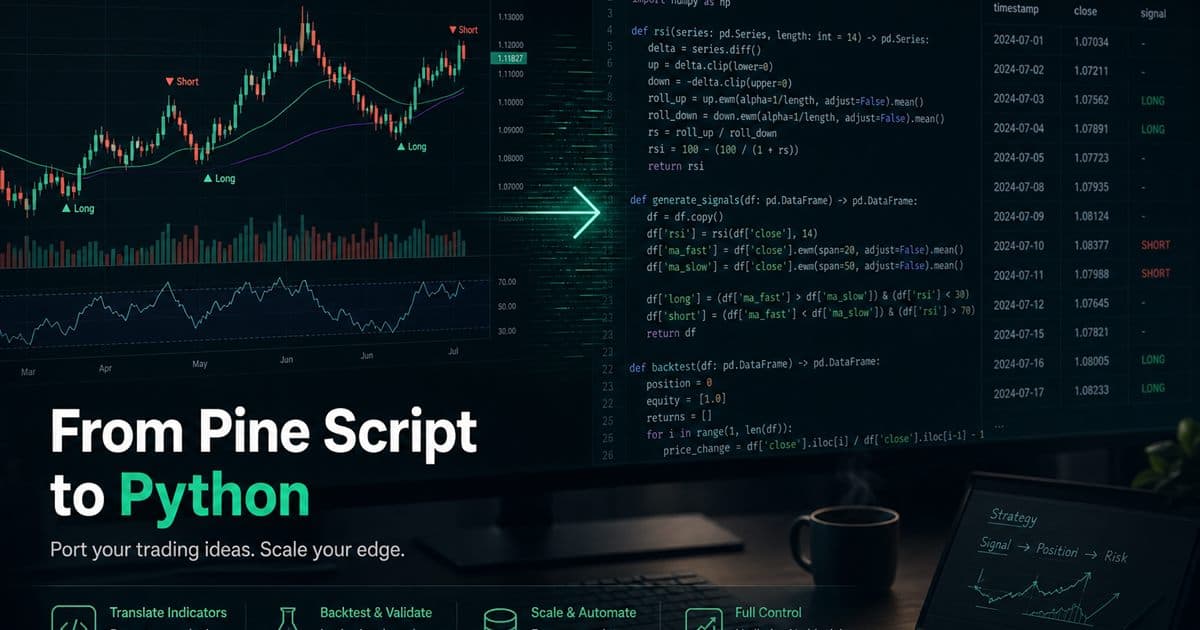
TradingView is where the idea lives. Production is where the idea has to survive contact with git, pytest, and a broker that doesn't care about your plot shapes.
We started from a dense Pine script — VuManChu signals, fib swing machinery, higher-timeframe filters, calendar gates, the whole stack. The port wasn't a line-for-line translation exercise. It was a decision about what actually moves PnL versus what only moves pixels.
What crossed over
- Every input.default became a typed param object — YAML on disk, JSON in the terminal.
- Indicators computed once per bar, exposed as columns the backtest engine can consume.
- Signal builder merges strategy legs (VuManChu vs fib swing) without forking the portfolio logic.
- Alert conditions from Pine became structured events — useful for paper logs, not chart decoration.
What we left on the chart
Lines, labels, and rainbow plots don't change fills. We dropped drawing code on purpose. If a value gates a trade, it's in the dataframe. If it's aesthetics, it's gone.
The parity argument
Parity isn't "same green triangles." It's same bar semantics: process orders on close, no pyramiding, bracket stop/target resolution, conservative intrabar ordering when both levels touch. We reference the original script by line range in comments — not for nostalgia, but so drift is auditable.
Once Python owns the signal path, backtests become reproducible artifacts. Paper trading uses the identical function. Live deployment loads the same saved strategy JSON. That's the whole point — one brain, many runtimes.